Abstract
This report presents the results of the peatland mapping, carbon stock estimation, land use assessment and the evaluation of CO2 emissions avoidance potential in the Equatorial Nile (Nile Equatorial Lakes NEL and
Sudd) and Blue Nile sub-systems (Ethiopia). The total area of peatlands and other organic soils in the total Nile Basin amounts to about 30,445 km2(3,044,500 ha). This area contains a peat carbon stock of 4.2 - 10 GtC (Gt= 1x10⁹
tonnes; C= organic carbon), i.e. 5 to 10 % of the total tropical peatland carbon stock. The range is caused by uncertainties in peat depth and carbon density of the peat.
The NEL region is estimated to contain 12,534 km2 of peatlands and to contribute 58.5 % of the total carbon stock of the Nile Basin. The majority of the NEL region peat carbon stock is located within the subbasins of Lake Victoria and the Victoria Nile, especially the Kagera subset, which contains about 50 % of all peatlands in the NEL region. The Lake Albert sub-basin also contains substantial peatland areas but is the smallest peatland area of the NEL region.
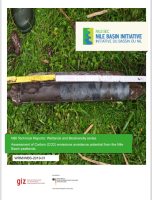
The most important concentration of peatlands in the Nile Basin lies possibly in the Sudd wetlands, where the estimate area of peatlands (organic soils) is ~15,780 km2, which would represent about 50 % of the total peatland area and 37 % of the total carbon stock of the entire Nile Basin. The proportionally small carbon stock value is attributable to the use of a small average peatland depth (2 m) compared to the rest of the peatlands in the Nile Basin. The Blue Nile sub-system (Ethiopia) holds an estimated peatland extent of about 1110 km2, concentrated around Lake Tana and the south-western Ethiopian Highland. The latter peatlands have only recently been discovered and remain largely unknown, probably because their vegetation differs from the standard papyrus. Most peatlands are characterized by papyrus (Cyperus papyrus L.), but Raphia palms, other sedges (e.g. Cyperus latifolia) and tall grasses are also common, and partly grow in patches together with papyrus. Peat deposits are mostly found in dendritic shaped valleys, which may be channelled, i.e. with a river flowing in the middle (e.g. Akanyaru peatland in Rwanda) and/or non-channelled (e.g. mountain peatlands in Ethiopia). Peat deposits were also found in the floodplains of lakes (Victoria, Albert, George and Mburo/Nakivali) and on river banks, e.g. of the Kagera and Albert rivers. Afro Alpine peatlands occur in various parts of the Nile Basin at high altitudes (4000 m). Land use change has recently accelerated and an increasing area of peatlands is being impacted directly (burning and clearing for agriculture, peat extraction for energy) or indirectly (drainage for infrastructure, surrounding plantations causing groundwater drawdown). The impact depends on the duration and intensity of use. Other threats to peatlands include changing rainfall patterns and fire hazards. The consequences are increased CO2 emissions and the loss of carbon stocks and productive land.
Peat carbon stock losses and emission reduction potential within the NEL region were explored with a model assuming that in 2015 25% of all peatlands were drained and that from 2015 until 2050 the drained area will increase annually with 1 % of all peatlands. The resulting losses of about 0.2 GtC over the period 2015 - 2050 can be regarded as CO2 emission reduction potential if no new drainage will be implemented and all drained peatlands are rewetted in 2025. Potential emission reduction scenario would then be in total 678 Mt CO2, or 19.4 Mt CO2 per year. The carbon stock losses and emission reduction potential are proportionally higher with a larger proportion of drained peatland in 2015, like Kenya and Rwanda (both 46 %) and Burundi (91 %). Calculations based on a more differentiated estimation of initial (2015) drained area per country arrives at a higher emission reduction potential for the NEL countries of 885.5 Mt CO2.